
How to Read Candlestick Charts: Beginner Day Trading Guide

OPULENTIX
Official Channel
Candlestick Charts, Explained Like You’re Starting Day One
Q: Why do traders stare at a screen full of red and green bars?
Because each bar is a tiny story about the fight between buyers and sellers. Learn to read that story and a messy chart starts to make sense.
Q: Do I need experience to follow this video?
No. It starts from the very beginning, explaining what a single candle shows, then moves on to multi-candlestick patterns that hint at where price may go next.
Q: Which chart patterns does it cover?
Three popular setups that day traders watch closely: the Bull Flag, the Flat Top Breakout and the ABCD Pattern. Each one is shown on real charts so you can learn to spot it yourself.
Q: What tools are used alongside the candles?
Quite a few. You learn how to use VWAP, how moving averages guide your read of the trend, and why volume bars can confirm or weaken a move. There is also a section on picking the right stocks to watch in the first place.
Q: How do different timeframes fit together?
The video walks through multi-timeframe alignment, comparing 1-minute, 5-minute and daily charts so you do not trade against the bigger picture. It also explains gaps (windows) and how ascending and descending resistance work.
Q: Is there an actual strategy?
Yes. Around the 45-minute mark the instructor pulls everything together into a day trading strategy, then finishes with recommended books for further study.
📌 Best for: beginner traders, students, and anyone curious about the stock market who wants a clear, practical start.
⚠️ Educational content only, not financial advice. Trading involves risk, so practice with a simulator first.
Suggested For You
 NEW
Ultimate Digital Marketing Masterclass: Scale to £50M+
OPULENTIX
1 views • 3 hours ago
 NEW
Master AI Agents in 2 Hours: The Ultimate Full Course
OPULENTIX
1 views • 3 hours ago
 NEW
How to Format a Children’s Book in Canva for Amazon KDP | Step by Step
OPULENTIX
7 views • 2 days ago
 NEW
$68K Per Month Trading Strategy | Full Course
OPULENTIX
3 views • 3 days ago
Up Next / Watch Later
 ▶ PLAYING
Production RAG with LangChain & Vector Databases: Full Course
OPULENTIX
0 views • 27 minutes ago
 ▶ PLAYING
Trading Using Order Flow: Full Masterclass
OPULENTIX
3 views • 32 minutes ago
 ▶ PLAYING
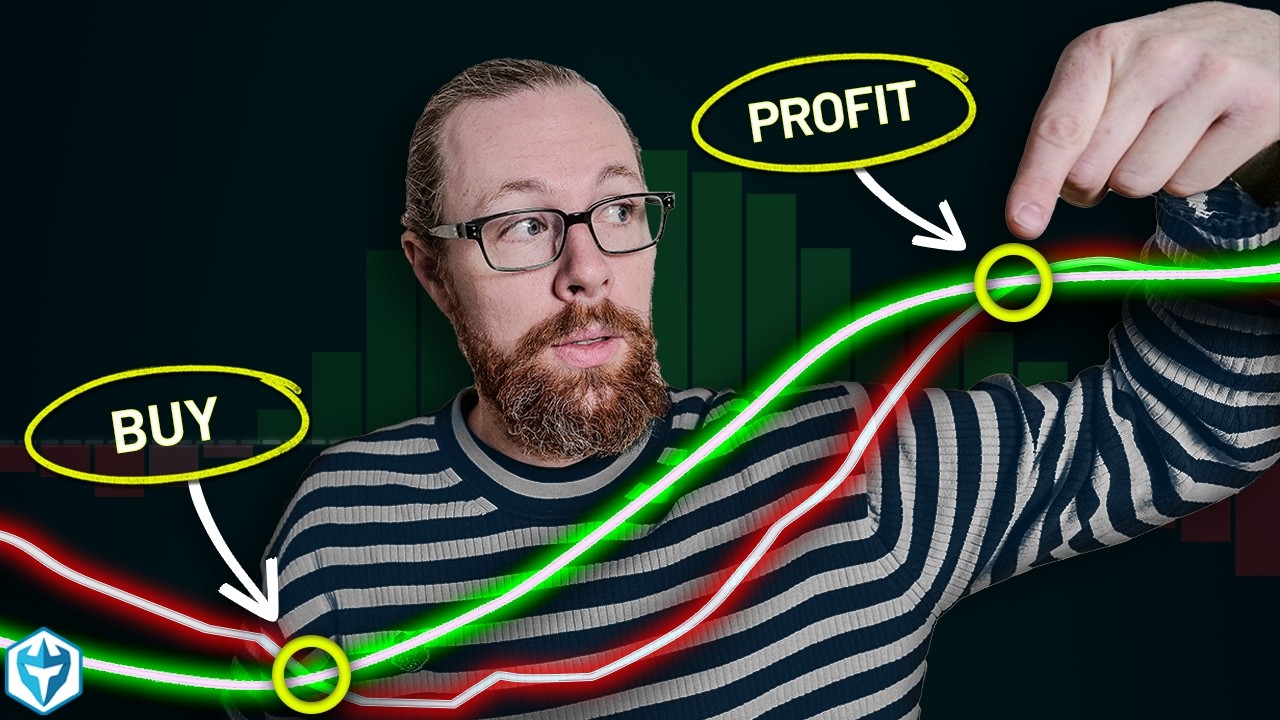
How to Read Technical Indicators on Candlestick Charts | Full Beginner Guide
OPULENTIX
0 views • 39 minutes ago
 ▶ PLAYING
JavaScript Beginner Course for Free: Learn to Code From Scratch
OPULENTIX
0 views • 53 minutes ago
 ▶ PLAYING
ReactJS Full Course: Build & Deploy 3 Modern Web Apps (Beginner Guide)
OPULENTIX
1 views • 58 minutes ago