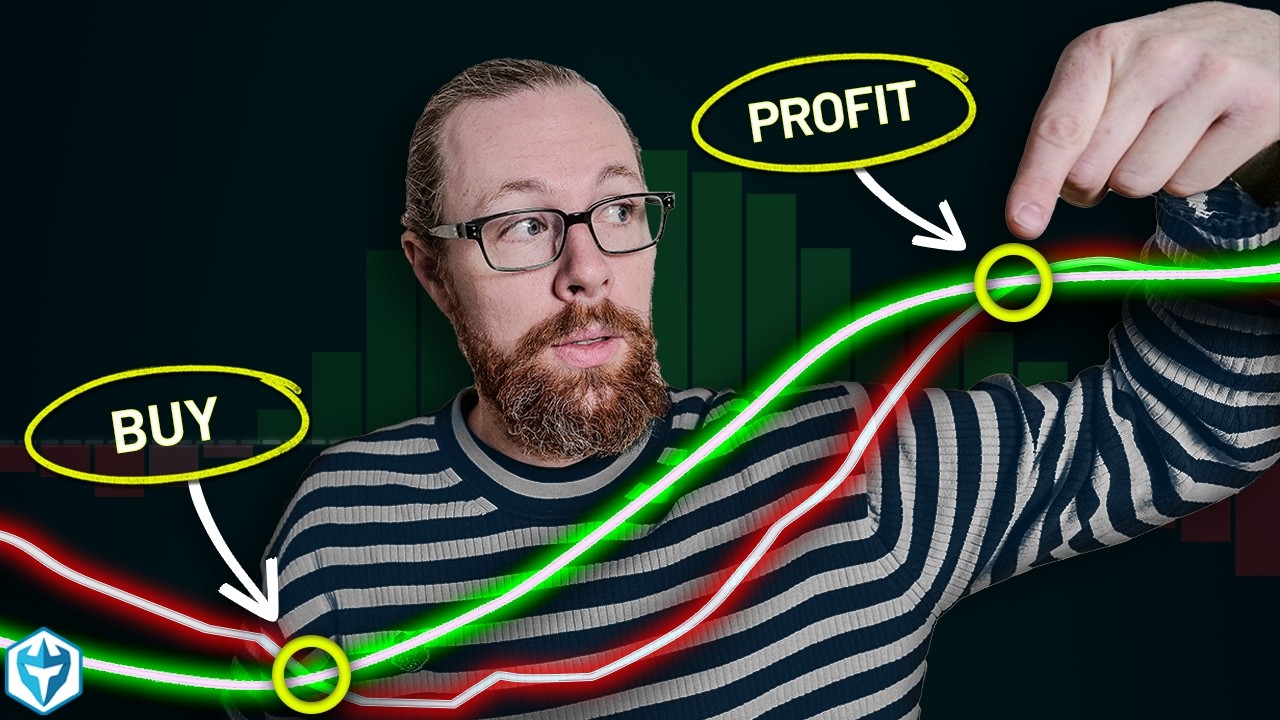
How to Read Technical Indicators on Candlestick Charts | Full Beginner Guide

OPULENTIX
Official Channel
Your Chart Is Full of Lines and Numbers. Here’s What They Mean.
Open any trading platform and you’ll see candlesticks surrounded by overlays, bars and oscillators. For a newcomer, it looks like a cockpit with no manual. This video is that manual.
What you’ll learn
The lesson shows how technical indicators work together with candlesticks rather than replacing them. Candles show you what price just did. Indicators help you put that movement in context, such as the strength of a trend, the momentum behind a move, or whether the market may be stretched.
How to approach it
- Start with the candles. Understand what each bar is showing before adding anything else.
- Add indicators one at a time. Too many on one chart create noise and confusion.
- Look for confirmation. An indicator is most useful when it agrees with what price action is already suggesting.
- Practice before risking money. Use a simulator or paper trading account while you build your skills.
Who is it for?
Beginner traders, students of the markets, and anyone who wants to read charts with more confidence.
📌 Important disclosure: My results are not typical. We do not track the typical results of past or current customers. As a provider of trading tools and educational courses, we do not have access to customers’ personal trading accounts or brokerage statements, so we have no reason to believe our customers perform better or worse than traders as a whole.
⚠️ This video is for educational purposes only and is not financial advice. Trading involves risk, including the possible loss of capital.
Suggested For You
 NEW
Ultimate Digital Marketing Masterclass: Scale to £50M+
OPULENTIX
2 views • 4 hours ago
 NEW
Master AI Agents in 2 Hours: The Ultimate Full Course
OPULENTIX
2 views • 4 hours ago
 NEW
How to Format a Children’s Book in Canva for Amazon KDP | Step by Step
OPULENTIX
7 views • 2 days ago
 NEW
$68K Per Month Trading Strategy | Full Course
OPULENTIX
3 views • 3 days ago
Up Next / Watch Later
 ▶ PLAYING
Production RAG with LangChain & Vector Databases: Full Course
OPULENTIX
0 views • 1 hour ago
 ▶ PLAYING
Trading Using Order Flow: Full Masterclass
OPULENTIX
4 views • 1 hour ago
 ▶ PLAYING
JavaScript Beginner Course for Free: Learn to Code From Scratch
OPULENTIX
0 views • 1 hour ago
 ▶ PLAYING
ReactJS Full Course: Build & Deploy 3 Modern Web Apps (Beginner Guide)
OPULENTIX
1 views • 1 hour ago
 ▶ PLAYING
How to Read Candlestick Charts: Beginner Day Trading Guide
OPULENTIX
1 views • 1 hour ago